Scalper1 News
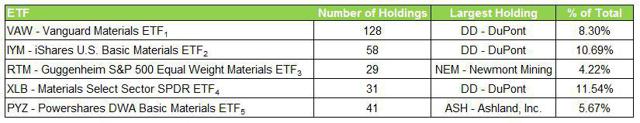
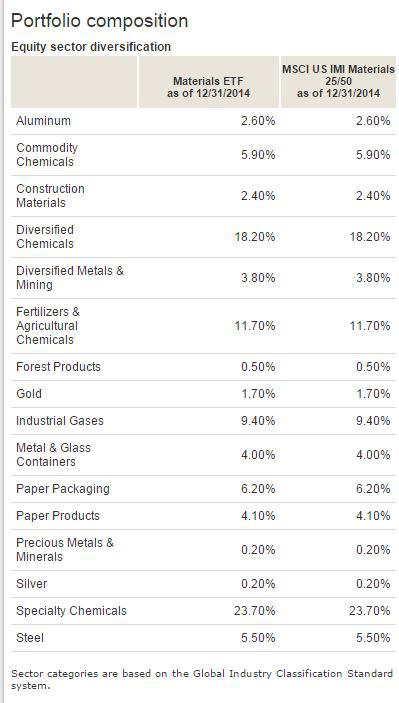
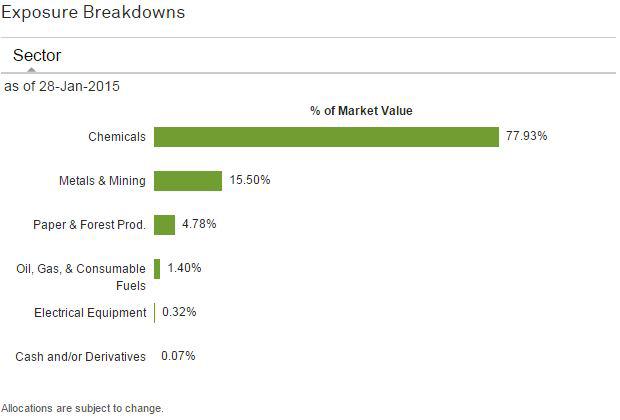
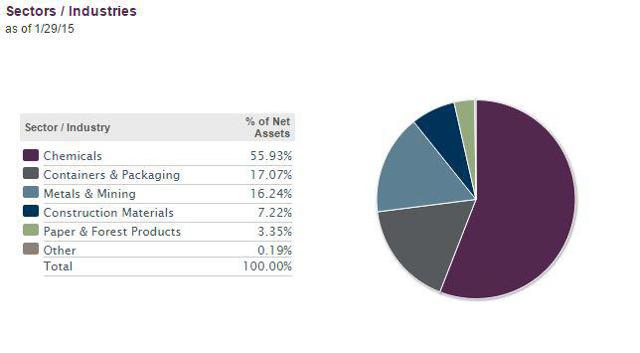
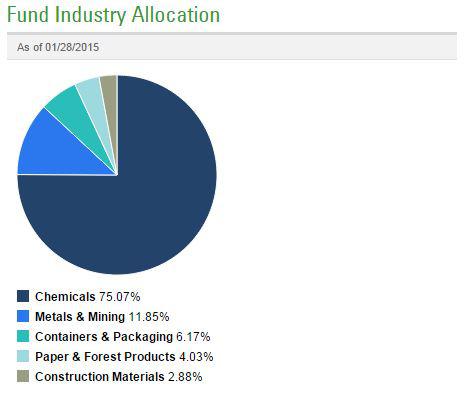
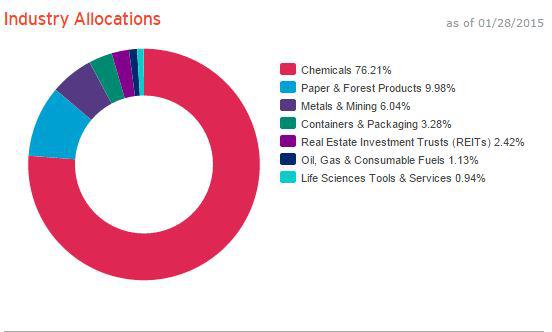
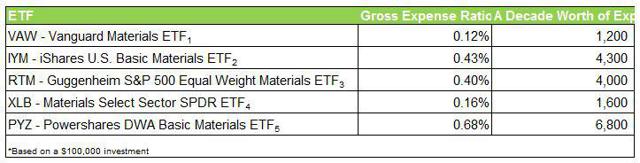
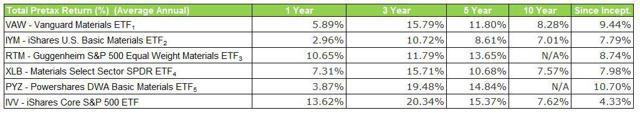
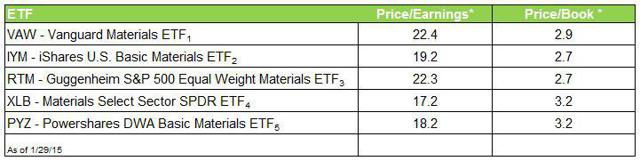
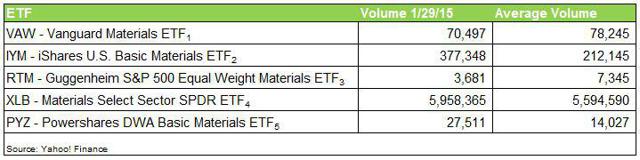
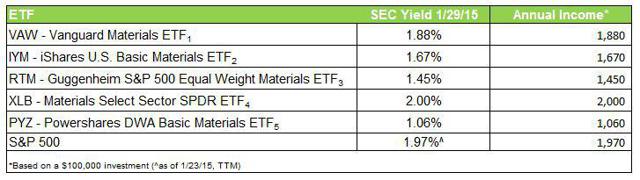
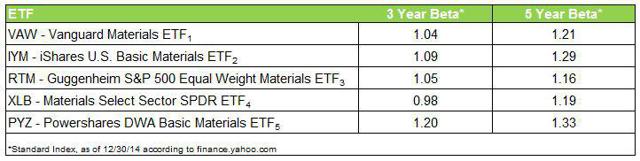
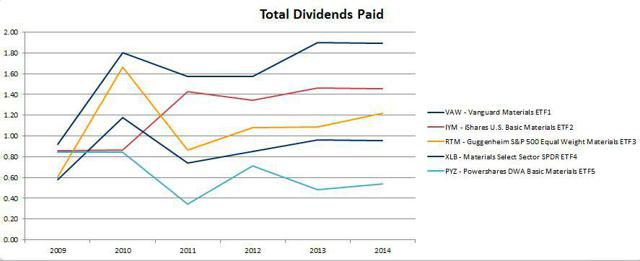 Summary These ETFs allow investors to obtain exposure to companies that provide a variety of inputs and raw materials essential to global economic function. As a whole, materials ETFs are more volatile and yield less than the S&P 500, but exceptions can be found. These funds offer varying risk and composition profiles that can be appropriate for a wide range of investors. Profiling the contenders (unless otherwise stated, market prices, NAV and SEC yield as of 1/29/15) : Vanguard Materials ETF (NYSEARCA: VAW ) This ETF seeks to track the performance of a benchmark index that measures the investment return of stocks in the materials sector and includes stocks of companies that extract or process raw materials. Market price: $104.73 30-day SEC Yield: 1.88% Number of holdings at 12/31/14: 128 iShares U.S. Basic Materials ETF (NYSEARCA: IYM ) This ETF seeks to track the investment results of an index composed of U.S. equities in the basic materials sector. It offers exposure to U.S. companies involved with the production of raw materials including metals, chemicals, and forestry products. Market price: $79.97 30-day SEC Yield: 1.67% Number of holdings at 01/28/15: 58 Guggenheim S&P 500 Equal Weight Materials ETF (NYSEARCA: RTM ) This ETF seeks to replicate as closely as possible, before fees and expenses, the performance of the S&P 500 Equal Weight Index Materials. Market price: $83.16 30-day SEC Yield: 1.45% Number of holdings at 01/29/15: 29 Materials Select Sector SPDR ETF (NYSEARCA: XLB ) This ETF seeks to provide investment results that, before fees and expenses, correspond generally to the price and yield performance of the S&P Materials Select Sector Index. Market price $47.88 30-day SEC Yield: 2.00% Number of holdings at 01/28/15: 31 Powershares DW A Basic Materials Momentum ETF (NYSEARCA: PYZ ) This ETF seeks to provide investment results that, before fees and expenses, correspond generally to the price and yield performance of the S&P Materials Select Sector Index. Market price $51.56 30-day SEC Yield: 1.06% Number of holdings at 01/28/15: 41 1) Diversification Diversification is the process of reducing non-systematic risk by investing in a variety of assets or asset classes that (hopefully) do not move up or down in value at the same time or magnitude. For the purposes of analyzing materials ETFs, I will look at both the number of holdings and also the industry diversification of constituents. a) Number of holdings An ETF does not need to hold every company of every sector that comprises its benchmark index, but 2 – 3 companies per industry is my subjective minimum to achieve adequate diversification. The basic materials sector can be broken up into roughly 20 industries including: agricultural chemicals, aluminum, chemicals – major diversified, copper, gold, independent oil & gas, industrial metals & minerals, major integrated oil & gas, nonmetallic mineral mining, oil & gas drilling & exploration, oil & gas equipment/services, oil & gas pipelines, oil & gas refining & marketing, silver, specialty chemicals, steel & iron, and synthetics. (click to enlarge) Winner: Vanguard. While some sub-sectors in the basic materials universe move in tandem, (think Oil and Gas drilling and Oil and gas marketing/refining both benefit from higher oil prices), other industries do not. Vanguard’s 128 holdings double its next closest competitor giving it the best shot at reducing non-systematic risk to an acceptably low level. b) Industry concentration Vanguard Materials ETF Courtesy of Vanguard iShares U.S. Basic Materials ETF Courtesy of BlackRock Guggenheim S&P 500 Equal Weight Materials ETF (click to enlarge) Courtesy of Guggenheim Investments Materials Select Sector SPDR ETF Courtesy of State Street Powershares DW A Basic Materials Momentum ETF Courtesy of Invesco Winner: Guggenheim. While Vanguard appears to be the most diversified with no component making up more than 25%, a closer look at captions reveals it is nearly 60% chemicals (just broken into various subcategories). Guggenheim is more balanced with three industries making up 10% or more of total weighting and while it is still heavy on chemicals, its overall chemical concentration is the lowest. 2) Expense ratio Expense ratio is the total of a funds operating expenses, expressed as percentage of average net assets. These expenses include management fees, Distribution/service or “12b-1” fees, custodial, legal, accounting, etc. Lower expense ratios, either through larger ETF size or smaller nominal expenses means higher investment returns. (click to enlarge) Winner: Vanguard, and everyone else. According to Morningstar , the average expense ratio for similar funds was 1.47%. Keeping fees and transaction costs as low as possible is something investors should always keep on the forefront of their mind. 3) Total return (click to enlarge) Winner: Powershares. I am always mentally benchmarking indexes and companies based on how they fared through and since the financial crisis. To look at that, you need to include several years before 2008. Powershares Basic Materials ETF was established in 2006, and its 3, 5 and (almost) 10 year returns (including the 2008 ordeal) are essentially on track with the S&P. That is saying something for a relatively narrowly focused ETF. 4) Valuation multiples (click to enlarge) Winner: SPDR. The SPDR ETF is trading at a discount to the S&P 500 (19.71) on a price to earnings basis. Honorable mention, iShares and Powershares whose earnings are also cheaper than those of the S&P 500. 5) Liquidity The ability to get out of a great investment is just as important as the ability to get in. While ETFs are generally regarded as having higher liquidity than mutual funds (primarily because they can be traded throughout the day, rather than just at the end), there are reasons to avoid ETFs with excessively low volume. Chief among these are higher bid-ask spreads, which may result in the inability to profitably execute a short-term trade (not a real issue for long-term investors). However, one of the issues that arises from low liquidity (a deviation between price and NAV) can actually be an opportunity. If an ETF is trading slightly below its NAV, but the market is not active enough for it to quickly resume equilibrium, you can shave a few points off your basis by looking for opportune entry points. (click to enlarge) Winner: SPDR. Higher volume means tighter bid-ask spreads, full stop. 6) Yield (click to enlarge) Winner: SPDR. SPDR is the only ETF that has a 30 day SEC yield greater than the S&P 500. The 30-day SEC yield is an annualized yield formula mandated by the Securities and Exchange Commission that is based on projected dividend yield of the fund’s holdings over a trailing 30 day period. 7) Volatility (click to enlarge) Winner: SPDR. This ETF exhibited lower volatility than all of its competitors over a three-year time frame and all but Guggenhem over five years. 8) Dividend history and growth (click to enlarge) Winner: Guggenheim. While it had a big drop off in distributions from 2010 – 2011, it has increased total distributions every year since then. Note for consideration, all of these funds pay quarterly distributions except for Vanguard, which pays annually. So, which Materials ETF should you own? SPDR! The Materials Select Sector ETF by SPDR is: the most active (liquid), the least volatile, offers the highest yield, the second lowest expense ratio, and trades at the lowest multiple of earnings. A word of caution Materials ETFs lagged the market as a whole in 2014. While last year’s losers can become this year’s winners, that is not always the case. A strong dollar can hurt the materials sector as it makes purchases of materials sector goods by foreign companies more expensive. Do your homework, review the composition and risk profile of each of these ETFs and monitor your holdings. Disclosure: The author has no positions in any stocks mentioned, and no plans to initiate any positions within the next 72 hours. (More…) The author wrote this article themselves, and it expresses their own opinions. The author is not receiving compensation for it (other than from Seeking Alpha). The author has no business relationship with any company whose stock is mentioned in this article. Scalper1 News
Scalper1 News