Scalper1 News
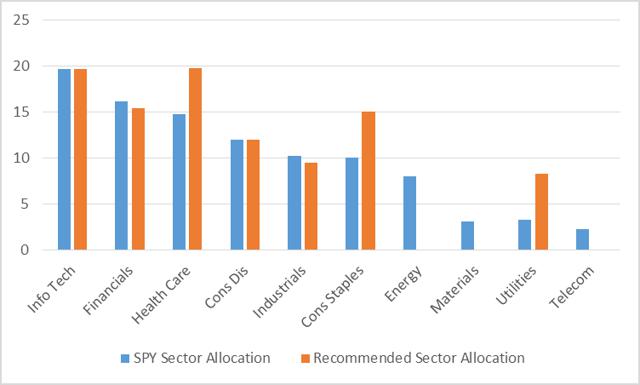
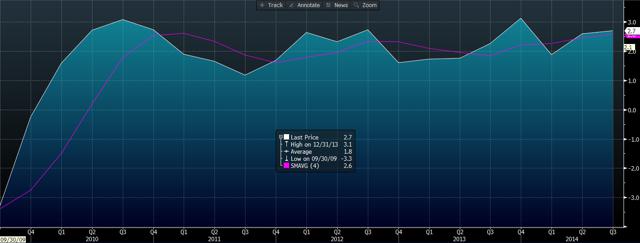
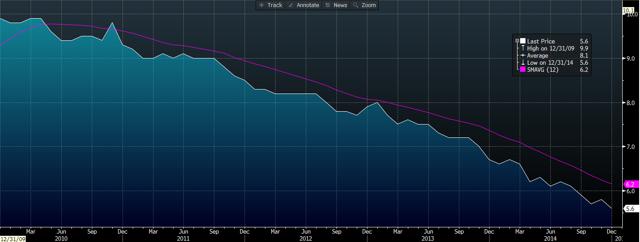
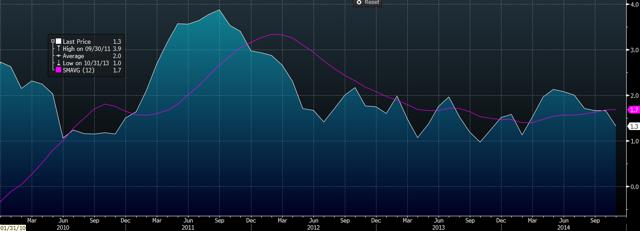

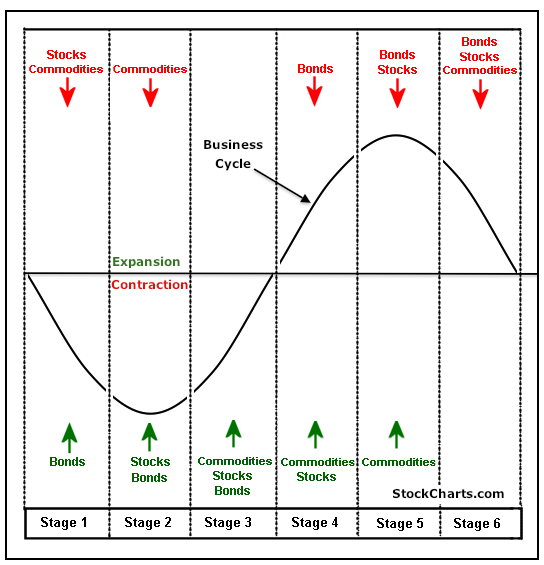
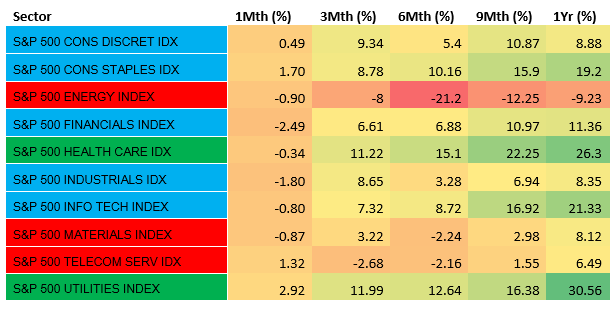
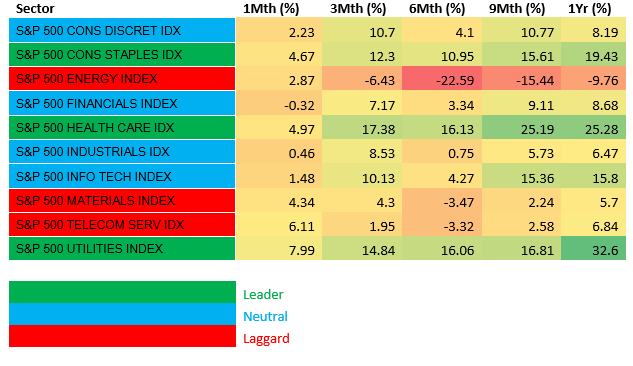
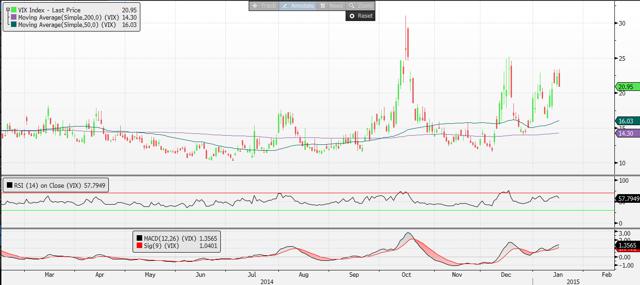
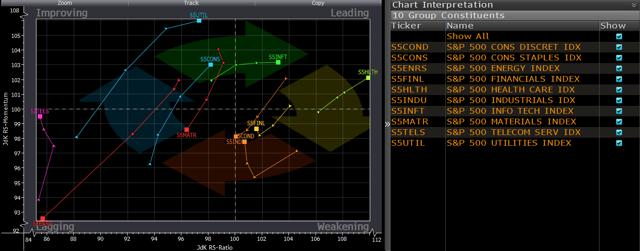
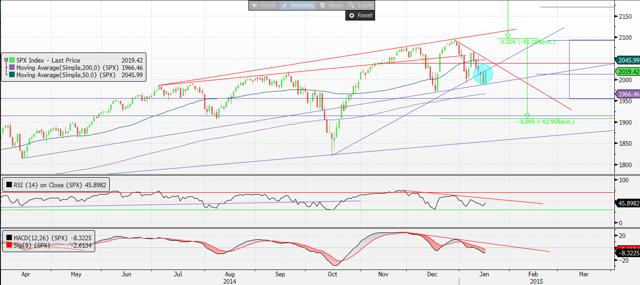 Summary The U.S. Economy is growing at an above trend pace over the last 2 quarters. Despite this there has been recent volatility in U.S. equity markets and there was a shift in sector performance. Nonetheless the trend in the S&P 500 remains intact with a 3 month outlook on the S&P 500 at 1170. A Red Flag On The S&P 500 I love the beach. Almost every weekend I would go on afternoons and take a swim. I would build sand castles and often times swim in the water and if I were hungry I would go by the local kiosk and eat some delicacies such as “Bake & Shark” or “pholouri”. Those were fun times. Even now when I get an opportunity I would spend some of my vacation days by the beach relaxing on the sand. But every time by the beach wasn’t always pristine. On some days there would have been rough waters or areas of roughness by the bay. The lifeguards would put up these red flags by the areas that were not safe for swimming. The red flags were a warning for swimmers so that drowning would be prevented. On the Friday 16th January 2015 close of the U.S. equity market, I observed a red flag on the S&P 500 Index. While the U.S. economy has been moving at an above trend pace over the past couple of quarters and the risk premium for investing in U.S. stocks are at 1-year lows, there has been a shift in sector performance, showing that the S&P 500 Index is becoming defensive. As such a new asset allocation is recommended. While still being overweight in U.S. equities by having a position in the SPDR S&P 500 Trust ETF (NYSEARCA: SPY ), a heavy overweight position in the health care sector is recommended, through the Health Care Select Sector SPDR Fund (NYSEARCA: XLV ). Slightly overweight positions are proposed in the Consumer Staples Select Sector SPDR ETF (NYSEARCA: XLP ) and the Utilities Select Sector SPDR ETF (NYSEARCA: XLU ) . Neutral positions should be observed in info tech through the Technology Select Sector SPDR ETF (NYSEARCA: XLK ) and the Consumer Discretionary Select Sector SPDR ETF (NYSEARCA: XLY ). Finally underweight positions in the energy sector through the Energy Select Sector SPDR ETF (NYSEARCA: XLE ), the materials sector through the Materials Select Sector SPDR Fund (NYSEARCA: XLB ) and telecoms through the SPDR S&P Telecom ETF (NYSEARCA: XTL ) are also recommended. The table below illustrates the recommendations. Chart 1 – Recommended Portfolio Allocation Versus S&P 500 Index as at Jan 9 th 2015 (click to enlarge) Source: Cerebro Recommendation using Microsoft Excel By looking at the allocation the portfolio is prepped for rough waters. On a weekly basis the portfolio metrics utilized to derive the portfolio allocation will be analyzed to determine whether another shift in asset allocation is required. Economic Activity Over the past couple of quarters the U.S. economy has been operating at an above trend pace. Latest figures show that U.S. GDP grew 2.7% year over year in the 3rd quarter of 2014, 0.4% higher when compared to the previous comparable quarter. U.S. GDP growth is also moving above its 4 quarter moving average of 2.6%. Chart 2 – U.S. GDP Growth (Y-o-Y %) as at Sept 2014 (click to enlarge) Source: Bloomberg The U.S. has been one of the leaders of growth from the developed economies and this trend is expected to continue, with its consumers obtaining a stronger purchasing power due to a strengthening U.S. Dollar. One of the more visible aspects of an appreciating U.S. Dollar was the decline in WTI Crude Oil. The over 50% decline in oil should bode well for the U.S. consumer. The uptrend in growth is also expected to continue as the slack in the U.S. labor market recedes. Chart 3 – U.S. Unemployment Rate (%) as at Dec 2014 (click to enlarge) Source: Bloomberg The U.S. unemployment rate stood at 5.6% at the end of the year, below the 12 month average of 6.2% and it is the lowest rate over the past 5 years. The “weather” in the U.S. appears to be just fine. Things appear to be going so well in the U.S. that the Fed ended its Q.E. program in October 2014. Also analysts expect the Fed to be raising its benchmark rate by the 3rd quarter of 2015. The Fed has continuously reiterated that it is data dependent and it will not make a move in rates unless the data corroborates the move. This is why the rate increase is expected 6 months ahead because the inflation data does not reflect a hike in rates. Over the month of November, U.S. CPI had the largest decline since December 2008. The retreat was attributed to the precipitous fall in fuel. U.S. CPI fell to 1.3% year-over-year in November 2014. The less volatile core CPI fell 0.1% year-over-year to 1.7%. Energy costs fell 3.8% versus a month earlier, led by a 6.6% decline in gasoline. While rent, medical care and airline fares rose, it was negated by the largest drop in clothing costs in 16 years and the largest fall in prices in used cars & trucks in September 2012. The declining energy & transportation costs will help both companies and consumers, improving the expectations for an increase in the S&P 500 Index in the short to medium term. Chart 4: 5-Year Chart of U.S. CPI (Y-o-Y %) as at Nov 2014 (click to enlarge) Source: Bloomberg Relative Asset Allocation & Sector Rotation Metrics By looking at the performance of bonds, stocks and commodities, a next move in the asset class performance of stocks can be forecasted as all these assets are related. Table 1: Total Returns of SPY, the iShares 7-10 Year Treasury Bond ETF (NYSEARCA: IEF ) & the PowerShares DB Commodity Index Tracking ETF (NYSEARCA: DBC ) ETFs Over Various Time Periods as at Jan 16 th 2015 Source: Bloomberg Chart 5: 6-Stage Business Cycle Source: StockCharts Based on the total returns of the ETFs above, the commodities are in a bear market while stocks and bonds are performing positively. Based on the above data it can be said that we are in stage 2 of the business cycle, with stocks and bond prices expected to continue to increase. Given that U.S. yields are expected to decline, stocks remain favored over bonds with the earnings yield of the S&P 500 at 5.58% as at January 16th 2015 while the U.S. 10-Year yield is at 1.84%. The difference between the 2 asset classes is 3.74%. On average, over the past year, the S&P 500 made a daily low when the difference or spread was 3.49%. Another point to note is that on average, over the past 12 months, the spread when the S&P 500 made a daily high was 3.09%. Thus one can deduce that the S&P 500 is closer to making a new low than a new high and that this low would be made soon (and perhaps around the 2040 to 2015 price zone). A daily price high can be deduced when the spread between the S&P 500 earnings yield and the U.S. 10 Year yield nears or is less than 3.09%. It can be construed that investors are not prepared to invest in U.S. equities as the risk premium (the value attained for buying such a risky asset as U.S. equities) for investing in U.S. equities heads below 3.09%. While the “weather” appears good, the waters are rough and it triggered a red flag. This red flag was derived from the shift in sector performance over the last couple of weeks. The tables below denote the shift. Table 2: S&P 500 Sector Total Returns Over Various Time Periods as at January 9 th 2015 Source: Bloomberg Table 3: S&P 500 Sector Total Returns Over Various Time Periods as at January 16 th 2015 Source: Bloomberg The health care, consumer staples and utilities all became leaders, indicating that the market is defensive, despite the S&P 500 Index having a larger than average risk premium. This move in sector performance complemented the move in the VIX, a measure of volatility for the S&P 500, which made a daily high of 23.34, which is below the 1 year October 2014 high of 31.06. Chart 6: Daily VIX Candlestick Chart as at 16 th Jan 2015 (click to enlarge) Source: Bloomberg Despite the shift in total returns of the sectors, when the returns are weighed versus the S&P 500, which smoothens the data, the shift is not so drastic. Chart 6: S&P 500 Sector Relative Rotation Graph as at January 16 th 2015 (click to enlarge) Source: Bloomberg From the relative rotation graph above we can see that info tech and health care are the leaders while telecom, materials & telecom are the laggards. Utilities & consumer staples are neutral with positive momentum while financials and consumer discretionary are also neutral, with negative momentum. By marrying the two concepts, total return sector performance & sector relative rotation, the recommended sector allocation in chart 1 was derived. Technical Analysis Based on the chart analysis as well as the risk premium in the S&P 500, support is seen around the 2040 to 2015 price region, with the S&P 500 expected to reach 1170 over the next 3 months. Chart 7: S&P Index 500 Candlestick Chart as at Jan 16 th 2015 (click to enlarge) Source: Bloomberg Scalper1 News
Scalper1 News