Scalper1 News
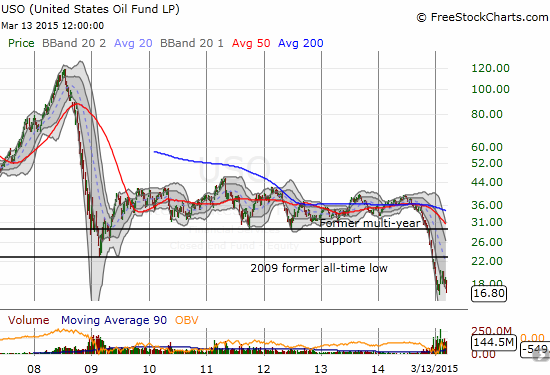
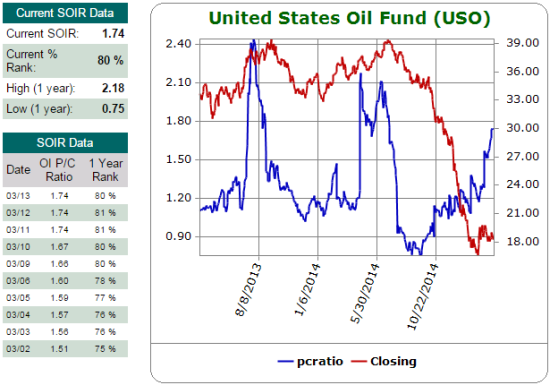
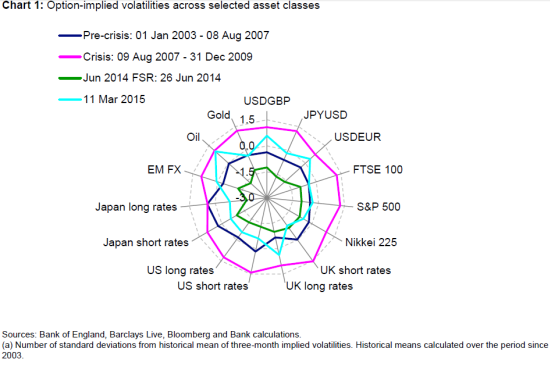
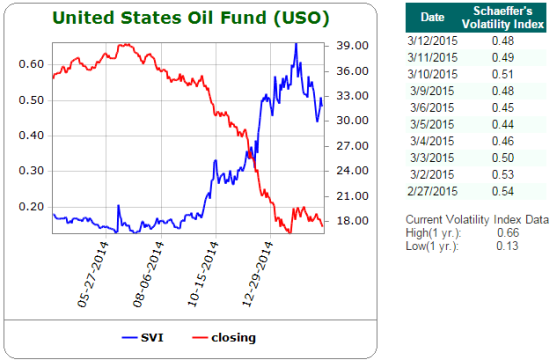
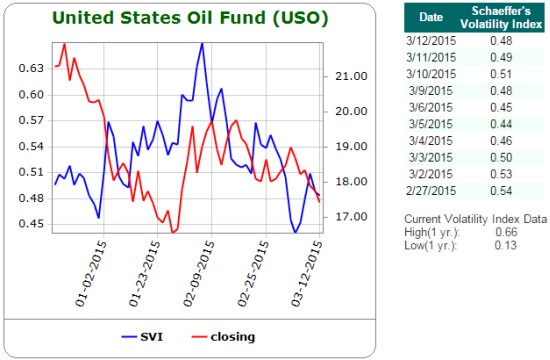
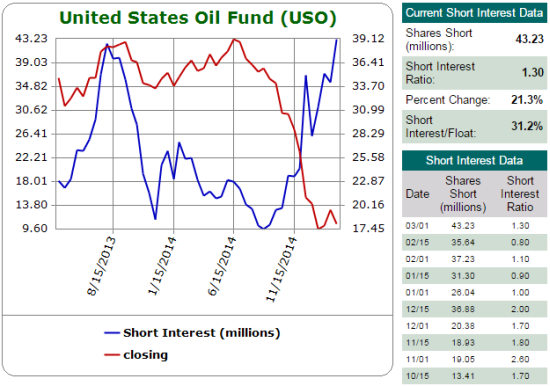
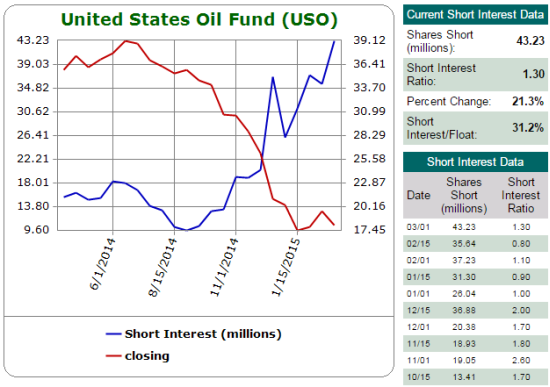
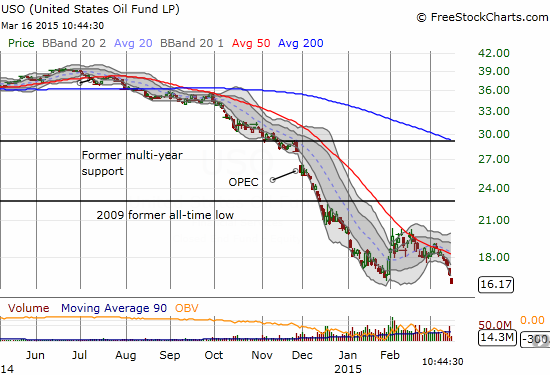 Summary Option-implied volatility on oil is at levels seen during the financial crisis, and short-term volatility on the United States Oil ETF has soared. While current momentum and fundamentals strongly favor the bears, it seems a recent large long-term bet against volatility is the best risk/reward trade on the United States Oil ETF. An analysis of the timing of various United States Oil ETF trades shows a strong bearish short-term opinion that is very reactive and a telling dispersion of longer-term opinion. On March 5, 2015, Barron’s Blogs published a short article on a large bet against volatility on the United States Oil ETF (NYSEARCA: USO ) called ” Big Options Bet Sees Oil ETF Rangebound into 2017.” The possibilities intrigued me because USO enjoyed a remarkable 5-year period of range-bound trading before the current plunge. After the bounce from 2009 lows, USO hit a high of around $46 in 2011 and a low of $29 once in 2011 and again in 2012. An extended period of relative tranquility has been rudely interrupted Directionless, long-term bets seem very reasonable especially given the runway allowed to close-out the trade at a profit well ahead of expiration. The key quote from the blog post: Energy-sector analysts continue debate the supply and demand picture, but one trader in the options market stepped up to the plate with a notably large, long-term wager oil stability. Andrew Wilkinson at Interactive Brokers noted the so-called ‘straddle’ position, which involved the simultaneous sale of ‘put’ options and ‘call’ options that expire way out in January 2017. Options are contracts that allow investors to buy or sell shares at a set price at a specific period of time. Selling options requires a bet against the underlying equity trading “in the money” by expiration. For call options, it is a bet that the underlying will close below the strike price plus the option premium. For put options, it is a bet that the underlying will close above the strike price minus the option premium. Selling BOTH call and put options on the same underlying is a bet that the underlying will stay within a range over time AND that volatility will generally decline over this time. If the underlying falls too far or gains too much too soon, losses could be great enough to force the trader to abandon the bet at a large loss. The Barron’s blog indicated that the big trade will work as long as USO remains within the range of $12.30/share to $25.70/share. It did not provide the specific strikes, so I directly reviewed the Jan 2017 strikes for large increases in open interest. After this process, I concluded that the swell of negative short-term bets combined with the dispersion of opinion on longer-term bets makes a directionless bet more intriguing. I used the options information in Etrade.com to look at the open interest on individual options as of the close Friday, March 13, 2015. The January 2017 calls with the largest open interest have strikes of $19 and $20 at 21,199 and 23,626 options, respectively. The January 2017 put options with the largest open interest have strikes of $19 and $20 as well at 20,178 and 17,975 options, respectively. There are no other strikes that even come close to these. Looking at the history of open interest, I found that the Jan $20 calls and Jan $20 puts have experienced steady increases in open interest since mid-January and early February, respectively. On the other hand, the Jan $19 calls and Jan $19 puts have both experienced large leaps in open interest. The open interest on the call options more than doubled to about 12,500 options on March 5th. The open interest on the put options went from a mere 2,500 or so to about 12,500 on March 5th. In both cases, traders have clearly piled into calls and puts on top of the initial surge – perhaps in imitation of the short straddle, perhaps as a result of differing interpretations on the implications for the large options trades. For reference, I looked at the other long-term options available for trading: the January 2016 expiration. Open interest in the January 2016 options is quite diverse. For call options, the top open interest sits at $25 with no other strike anywhere close to the 44,445 options. This is of course, right at the top of the range that the January 2017 trader is betting on. There are a cluster of call options ranging from 34,667 to 20,988 open interest scattered across $18, $20, $21, $28, $35 and $30 strikes in descending order. For put options, the $16 strike has an open interest of 52,625 with the $18 strike at a close second with 41,748 open interest. In the case of the call options, clearly some of the bets are very speculative. The calls at the $35 strike have been bought mainly in three separate chunks once in each of the months of November, December, and January at prices around $1.10, $0.45, and $0.17, respectively. So from the lens of individual options on a longer-term basis, the bets for or against USO represent a spread of market opinions. On a short-term basis, the opinion on USO is definitively negative although sentiment has hit even more negative levels before the big sell-off started. This sentiment has created substantial premiums on puts options. Schaeffer’s Investment Research calculates an open interest put/call ratio based on the options expiring within three months. It represents immediate market sentiment. The chart below shows three large spikes in the ratio; only the third turned out to be significant. Yet, traders still rapidly got more (relatively) bullish as the sell-off got underway. After hitting a major low, the ratio only tentatively stair-stepped its way higher until it finally soared in the past month AFTER USO made its last all-time low. The overall open interest put/call ratio stair-stepped tentatively until AFTER USO made its last major low In other words, the market only recently started to accept the bearish nature of the trading in USO as a result of the bearish fundamentals of on-going inventory builds and STILL rising production in oil (not to mention the contango conditions which promise to drag USO further down as the fund rolls over futures positions). Last week, Kuwait suggested that OPEC will continue its production policy in its upcoming June meeting. Also last week, the International Energy Agency (IEA) said …U.S. supply so far shows precious little sign of slowing down. Quite to the contrary, it continues to defy expectations. The organization does not expect production growth to slow until the second half of 2015. U.S. crude inventories are now at a record 468M barrels. (See Reuters ” IEA sees renewed pressure on oil prices as glut worsens” for more details on these developments). I suspect the issue of supply cuts will finally get forced when the marginal buyers of oil have to exit the market for lack of storage. At THAT point, perhaps some kind of sustainable bottom in oil will begin. In the meantime, the pressure on oil prices has created a surge in related measured volatility. The Bank of England recently published this spider chart showing option-implied volatility for oil is at levels seen during the financial crisis. Volatility across financial markets has expanded rapidly from last year’s levels – oil stands out as having reached levels of volatility equal to those of the financial crisis Schaeffer’s Investment Research calculates its own volatility index, the SVI, on individual equities. I believe it uses the front and second month options for its calculation . The SVI for USO has surged to tremendous highs but it has actually come off in recent weeks, likely a reflection of the relief from USO’s jump from recent lows. It took a while for the market to accept the tremendous downside potential on USO. The volatility index did not even reach a new high until the sell-off was about 3 months old. The volatility index on USO peaked just after its recent low. Source: Schaeffer’s Investment Research The behavior of the SVI suggests that the market in USO is very reactive rather than predictive. The extreme in the option-implied volatility on oil suggests that we are closer to the end than the beginning of the volatility spike in oil. If volatility measures on USO, like SVI, manage to make fresh highs, such a move could represent a final washout of negative sentiment. Time seems to be on the side of the big seller of the straddle on January 2017 options. Like the open interest put/call ratio, it took the failure of OPEC’s November meeting to prop up prices for USO shorts to get really serious. In other words, there was a lot of latent expectation (hope?) that OPEC would succeed in efforts to manipulate the market. Shares short on USO are now back to levels last seen in the summer of 2013. Note how that ramp evaporated quickly after USO declined mildly for a few months. Shares short on USO were sitting at a major low one month into the sell-off… Here is a close-up showing how fast shorts piled up after the OPEC late November meeting. For example, shares short soared over 50% from December 1 to December 15. …and shares short did not take-off in earnest until December (after OPEC could not decide to cut production to try to prop up prices) As of the time of completing this piece, USO cracked a new all-time low as WTI crude hit lows not seen since March, 2009. The mild optimism that built from the earnings reports of various oil companies has faded in the wake of the market realities that continue to pressure oil lower. United States Oil ETF makes a new (intraday) all-time low shortly after opening for trading on March 16, 2015 Source: FreeStockCharts.com As I mentioned earlier, I think a major market event like an actual decline in U.S. inventories or the complete filling of storage capacity might be required to signal a more sustainable bottom in oil prices. Ahead of that, selling long-term volatility while premiums are high could be the best risk/reward trade available on USO. Until a major market event, the shorter-term momentum looks firmly in favor of the bears. Be careful out there! Disclosure: The author has no positions in any stocks mentioned, but may initiate a short position in USO over the next 72 hours. (More…) The author wrote this article themselves, and it expresses their own opinions. The author is not receiving compensation for it (other than from Seeking Alpha). The author has no business relationship with any company whose stock is mentioned in this article. Additional disclosure: Note that I may open a short and/or long position on USO in the next 72 hours. See article for more details. Scalper1 News
Scalper1 News