Scalper1 News
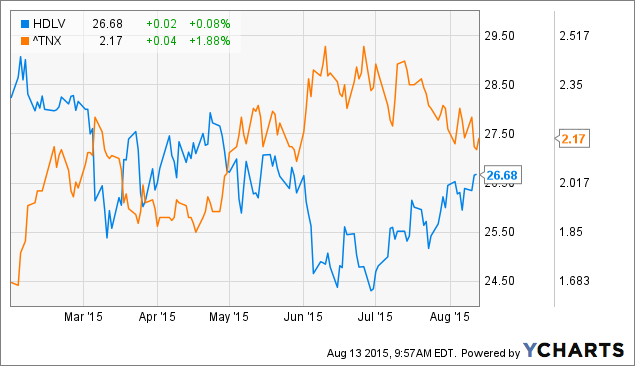
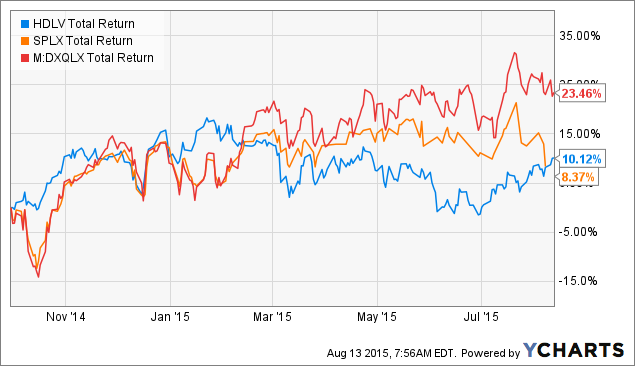
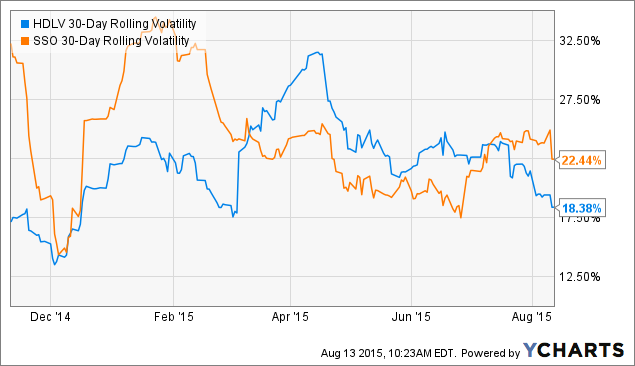
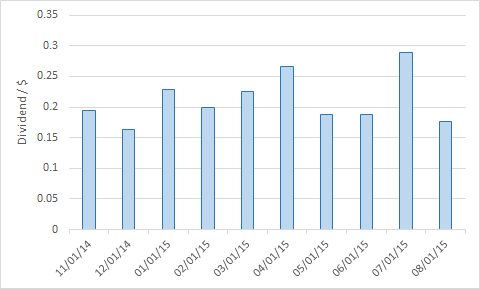 Summary HDLV is filled with blue-chip cash-generating machines. The recent mini-“Taper tantrum” sparked a sell-off in dividend stocks. HDLV is up only 12% from its 52-week lows and may be a good choice if interest rates don’t rise. Introduction In December of 2014, I comprehensively analyzed the methodology and composition of the ETRACS Monthly Pay 2xLeveraged US High Dividend Low Volatility ETN (NYSEARCA: HDLV ), a fund that was only incepted a few months prior. HDLV is a 2x leveraged fund that seeks to hold U.S. companies that possess both a high yield and low volatility. Readers may refer to my previous article for more detailed information on the methodology and composition of this fund. The recent mini-“Taper tantrum” has sparked a sell-off in dividends stocks, particularly those deemed to bond-like. Not surprisingly, this includes many of the top constituents in HDLV, which include blue-chip cash-generating machines such as Verizon Communications (NYSE: VZ ), AT&T (NYSE: T ), Philip Morris (NYSE: PM ), Altria Group (NYSE: MO ) and Duke Energy (NYSE: DUK ). As HDLV is nearly one-year old, this article seeks to provide an update on HDLV to see if it has been able to meet its dual mandate of high dividends and low volatility. Recent performance The graph below shows the price of HDLV and the yield of the 10-year treasury note since February of this year. We can see from the chart that the two lines move in opposite directions, suggesting that the recent price action of HDLV (or rather, its underlying constituents) has been driven by investor fixation on interest rates rather than any material change in the fundamentals of the companies. Interest rates have fallen again over the last two months, allowing HDLV to rise around 12% from its 52-week lows. HDLV data by YCharts How has HDLV performed relative to the broader market? HDLV is a 2X leveraged ETN that tracks twice the monthly performance of the underlying index, which has been considered to be a strategy that reduces the “beta decay” of leveraged securities. Therefore, the performance of HDLV since inception is compared to the UBS ETRACS Monthly Reset 2xLeveraged S&P 500 total Return ETN (NYSEARCA: SPLX ), and the Direxion Monthly NASDAQ-100 Bull 2X Fund (MUTF: DXQLX ), which track twice the monthly return of S&P 500 and NASDAQ-100, respectively. The chart above shows that DXQLX has had by far the best total performance. Although HDLV has recently underperformed, its total return since inception is still slightly higher than that of SPLX. Volatility Has HDLV managed to exhibit lower volatility than the broader market? Unfortunately, as SPLX is not very liquid, its volatility data is distorted by the high bid-ask spreads on the instrument. Therefore, I used the ProShares Ultra S&P 500, a daily-resetting 2X leveraged version of the SPDR S&P 500 Trust ETF ( SPY), instead. The graph below shows the 30-day rolling volatility of HDLV and the ProShares Ultra S&P 500 ETF (NYSEARCA: SSO ) since Nov. 2014. HDLV 30-Day Rolling Volatility data by YCharts The graph above shows that for slightly over half the time, HDLV has had a lower volatility than SSO, suggesting that is has been less volatile than the broader market. This data is corroborated by InvestSpy , which shows HDLV having significantly lower volatility and beta compared to SSO since inception. One area where HDLV appears to underperform SSO is in its maximum drawdown of -14.50% compared to -10.40% for SSO. However, the maximum drawdown figures may not be directly comparable because HDLV resets its leverage monthly whereas SSO resets daily. Ticker Annualized Volatility Beta Daily VaR (99%) Max Drawdown Total return HDLV 21.70% 1.13 3.20% -14.50% 14.60% SSO 25.20% 2 3.70% -10.40% 15.80% SPY 12.60% 1 1.90% -5.30% 9.00% Composition Since my last article in December of 2014, HDLV has undergone three rebalancing events (in January, April and July). The table below shows the top 10 constituents of HDLV in Dec. 2014 and Aug. 2015. Dec. 2014 Aug. 2015 Name Ticker Weighting / % Name Ticker Weighting ConocoPhillips (NYSE: COP ) 10.11 Verizon Communications Inc. VZ 9.89 Verizon Communications Inc. VZ 10.01 AT&T Inc. T 9.55 AT&T Inc. T 9.77 Philip Morris International PM 9.42 Philip Morris International PM 9.20 Altria Group Inc. MO 8.87 Altria Group Inc. MO 7.62 Duke Energy Corp DUK 6.89 Duke Energy Corp DUK 5.84 Southern Co SO 6.18 Southern Co (NYSE: SO ) 5.04 Ventas Inc (NYSE: VTR ) 4.06 Health Care Reit Inc (NYSE: HCN ) 3.90 Health Care Reit Inc HCN 3.70 PPL Corp (NYSE: PPL ) 3.34 Consolidated Edison Inc (NYSE: ED ) 3.68 Entergy Corp. (NYSE: ETR ) 3.11 HCP Inc (NYSE: HCP ) 3.29 Top 10 total 67.94 65.53 We can see that 7 companies, namely VZ, T, PM, MO, DUK, SO and ECN, have remained in the top 10 of constituents of HDLV since 8 months ago. 3 companies have been removed from the top 10 of constituents, including the former top holding COP, as well as PPL and ETR. Meanwhile, VTR, ED and HCP have joined the top 1o constituents of HDLV. Moreover, and as mentioned in my previous article, HDLV is a very top-heavy fund. The top 10 constituents currently account for 65.53% of the total assets of the fund, down slightly from 67.94% in Dec. 2014. As a counterpoint, given that the names in the top 10 are all blue-chip, cash-generating, “widow-and-orphan” stocks, this underdiversification of companies does not unduly worry me. However, what maybe a cause for concern is the underdiversification of sectors . The top 10, or 65.53% of the fund, is entirely concentrated into telecommunications (T, VZ), tobacco companies (PM, MO), utilities (DUK, SO, ED) and healthcare REITs (VTR, HCN and HCP). These sectors are quite interest-rate sensitive, and thus may all decline together when (if?) rates rise, or conversely move up together when rates fall, as has been the case for the past year. Dividends HDLV has paid out 10 dividends since inception, as shown in the chart below. These distributions sum up to $2.12, which based on the current price of $26.64 and annualized to 12 months represents a yield of 9.57% . Risks HDLV charges a management expense ratio of 1.45%, which constituents of a tracking error of 0.85% and a surreptitiously hidden financing spread of 0.60%. This is added to the three-month LIBOR of 0.31% to give a total expense ratio of 1.76%. While this seems high, keep in mind that owning HDLV allows you to effectively control 2X of assets. Therefore, dividing the total expense ratio of 1.76% by 2 gives an effective expense ratio per dollar of assets controlled of 0.88%. If we don’t include the LIBOR in the expense ratio, the effective expense ratio (-LIBOR) is 0.73%. While this is still higher than other popular dividend ETFs such as the iShares Select Dividend ETF (NYSEARCA: DVY ) (0.39%), the SPDR S&P Dividend ETF (NYSEARCA: SDY ) (0.35%) and the Vanguard Dividend Appreciation ETF (NYSEARCA: VIG ) (0.10%), the ability to access cheap leverage may still make this fund more cost-effective for investors than buying on margin themselves. Additionally, and as mentioned above, the constituents of HDLV are quite interest-rate sensitive, and so this fund will likely decline if interest rates spike higher. Finally, as HDLV is an ETN, it is subject to the credit risk of the issuer, in this case UBS. Conclusion I believe that HDLV has been able to meet its dual mandate of high and dividends and low volatility over the past 12 months. Investors who believe that low interest rates are here to stay for longer will be attracted to the blue-chip, income-generating nature of the top constituents of HDLV. The 2X leveraged nature of HDLV has pushed its trailing yield to 9.57% (annualized from 10 months). Moreover, HDLV is currently up only around 12% from its 52-week lows, which may be an attractive entry point for initiating a position. On the other hand, drawbacks of this fund are its overconcentration in companies and sectors, and its sensitivity to interest rates. Readers interested in other high-dividend low-volatility funds may peruse my previous articles on the PowerShares S&P 500 High Dividend Portfolio ETF (NYSEARCA: SPHD ) and the Global X SuperDividend U.S. ETF (NYSEARCA: DIV ). Disclosure: I/we have no positions in any stocks mentioned, but may initiate a long position in HDLV over the next 72 hours. (More…) I wrote this article myself, and it expresses my own opinions. I am not receiving compensation for it (other than from Seeking Alpha). I have no business relationship with any company whose stock is mentioned in this article. Scalper1 News
Scalper1 News